
This month, our analytics team has explored how the supply of takeaways from a constantly changing range of merchants is fueling the Kiwi love for takeaways.
Growth in online shopping has seen durable goods such as clothing and electronics become more competitive. This has seen a decreasing share of New Zealanders spending going towards these types of purchases. On the other hand, spending on food and liquor has never been higher. While retail food has been enjoying a steady trajectory, the chief beneficiary has been hospitality and takeaways.
New Zealand has been found to be one of the world’s fastest growing takeaway markets, and takeaway foods are routinely the top-growing retail category in our weekly consumer spending series. While we know at a topline level that demand for the category has never been stronger, here we dig deeper into what has been happening on the supply side of the equation.
OVERALL GROWTH HAS BEEN STRONG
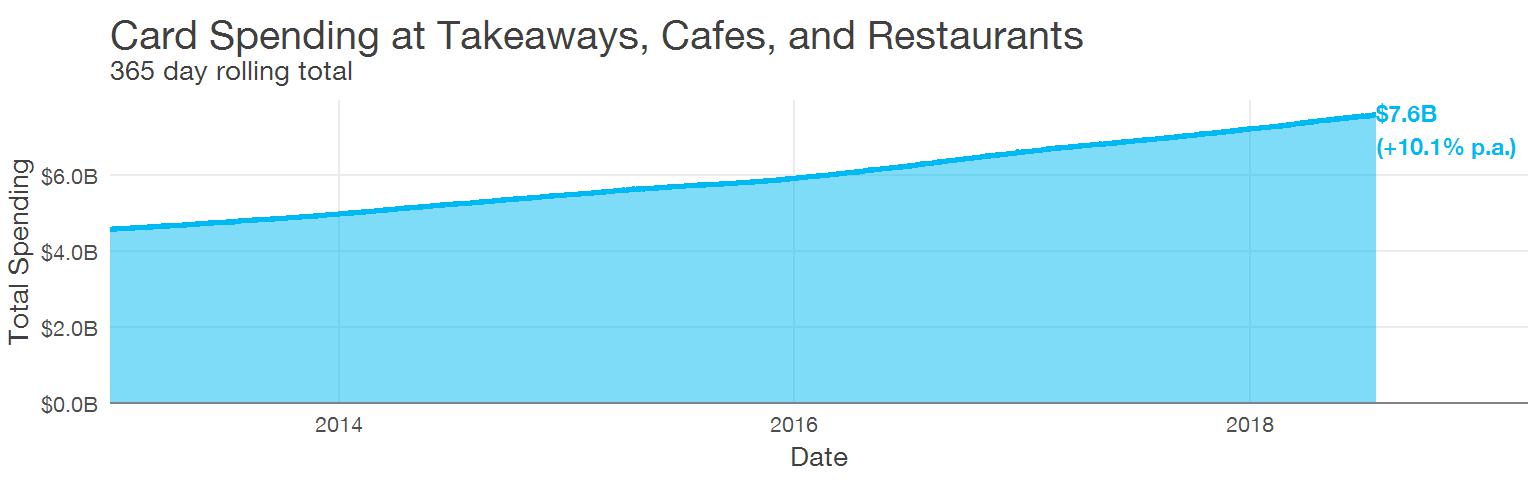
New Zealanders spending at takeaways, cafes, and restaurants has peaked at $7.6B in the 12 months ending June 2018. This represents a growth of 10.1% p.a. from 2013 to Q2 2018, well above the CPI and population growth during the same time period.
MERCHANT COUNTS HAVE NOT KEPT PACE
The growth in spending is unremarkable if it is a result of an increase in supply. If there is a corresponding increase in the number of available merchants, then the increase in spending is simply a reflection of a greater opportunity to purchase at hospitality and takeaways.
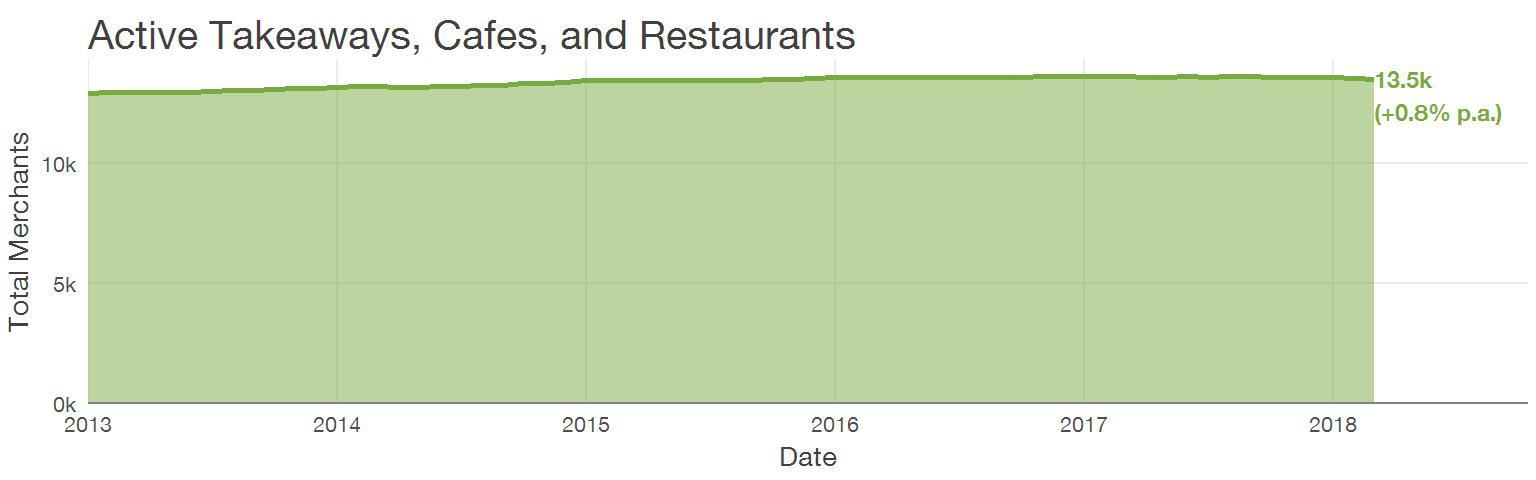
While the total number of outlets has increased, the overall growth has been an order of magnitude lower than that of the spending – total merchants are up 0.8% p.a. from 2013 to Q2 2018. In fact, in 2017 and 2018 to date, there has been a slight decrease in the number of merchants in this category across the country.
HOWEVER, MERCHANTS ARE CONSTANTLY CYCLING
While the overall number of active merchants is not dramatically increasing, it isn’t completely true to say that the growth in spending is not related to new merchants entering the market. As with all retail categories, takeaways and hospitality is in a constant state of flux, with merchants cycling in and out of the market.
In general, 13-15% of the active Takeaways, Cafes, and Restaurants each year will either have opened in the last 12 months or be about to close in the next 12 months. While the number of merchants that are active throughout an entire year is increasing, the number of new merchants appearing has been decreasing slightly. On top of this, the number of merchants closing their doors has increased over the last five years, from 905 in 2013 to 973 last year.
| Status |
2013 |
2014 |
2015 |
2016 |
2017 |
| Active Throughout Year |
12,060 |
12,311 |
12,548 |
12,615 |
12,676 |
| Opened During the Year |
1,146
8.1% |
1,185
8.2% |
1,065
7.3% |
1,032
7.1% |
921
6.3% |
| Closed Durng the Year |
905
6.4% |
898
6.2% |
940
6.5% |
984
6.7% |
973
6.7% |
Turnover of Takeaways, Cafes, & Restaurants in New Zealand
REGIONAL VARIETY
While Canterbury is experiencing a high net turnover of merchants, the number of new openings has outpaced their closures, with their market in net growth overall.
| Region |
Active Merchants |
Opened |
Closed |
Absolute Turnover |
Net Turnover |
| Bay of Plenty |
828 |
7.0% |
5.7% |
12.7% |
+1.3% |
| Canterbury |
1,721 |
6.9% |
6.4% |
13.3% |
+0.4% |
| Waikato |
1,352 |
6.0% |
5.8% |
11.8% |
+0.2% |
| Other North Island |
1,764 |
6.3% |
6.6% |
12.9% |
-0.2% |
| Wellington |
1,680 |
5.1% |
5.7% |
10.8% |
-0.7% |
| Other South Island |
783 |
5.6% |
6.5% |
12.1% |
-0.9% |
| Otago |
770 |
6.0% |
7.1% |
13.1% |
-1.2% |
| Auckland |
5,531 |
6.1% |
7.4% |
13.4% |
-1.3% |
Turnover in Merchants by Region (2017)
There is no clear relationship between merchant attrition and spending growth, and that’s because turnover is not necessarily a good or bad thing. By comparing both we can identify the regions which are performing well on both measures.
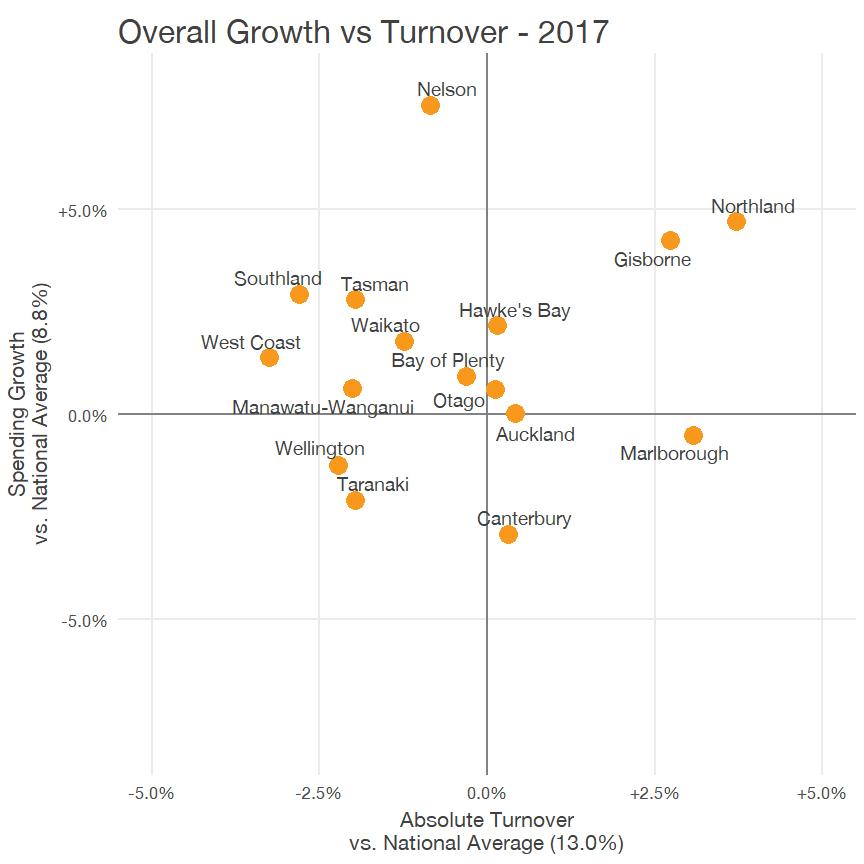
In the upper-left area, we see regions that have higher than average growth, with lower than average turnover:
- Nelson
- Southland
- Tasman
- West Coast
- Waikato
- Bay of Plenty
- Manawatu-Whanganui
Provided that growth is high, low turnover is desirable and represents stable supply with increasing demand.
In the upper-right, we see regions with high growth and high turnover:
- Northland
- Gisbourne
- Otago
- Hawke’s Bay
While these markets are displaying healthy growth, the high turnover of merchants indicates that these are more competitive areas for operators.
There are four regions with below-average growth (with Auckland sitting at almost the exact average); Wellington, Taranaki, Canterbury, and Marlborough. In the case of Taranaki and Wellington, the low turnover could be indicative of a market becoming stale. However it is important to keep in mind that while these markets sit below the national growth rate, they have still grown by at least 5.9% in 2017.
Consumers are favouring eating out as a meal option now more than ever before. While in absolute terms, the level of supply has not grown at a comparable rate, there has been a constant cycle of merchants entering and leaving the market, helping the keep the offering fresh.
The high turnover in merchants suggests that consumers are demanding more from their out of home dining. Takeaways becoming more ‘gourmet’ should see their popularity continue increasing, with successful operators enjoying the strong trend in consumer demand for high quality food with increased convenience.
Changing takeaway supply fueling high demand
This month, our analytics team has explored how the supply of takeaways from a constantly changing range of merchants is fueling the Kiwi love for takeaways.
Growth in online shopping has seen durable goods such as clothing and electronics become more competitive. This has seen a decreasing share of New Zealanders spending going towards these types of purchases. On the other hand, spending on food and liquor has never been higher. While retail food has been enjoying a steady trajectory, the chief beneficiary has been hospitality and takeaways.
New Zealand has been found to be one of the world’s fastest growing takeaway markets, and takeaway foods are routinely the top-growing retail category in our weekly consumer spending series. While we know at a topline level that demand for the category has never been stronger, here we dig deeper into what has been happening on the supply side of the equation.
OVERALL GROWTH HAS BEEN STRONG
New Zealanders spending at takeaways, cafes, and restaurants has peaked at $7.6B in the 12 months ending June 2018. This represents a growth of 10.1% p.a. from 2013 to Q2 2018, well above the CPI and population growth during the same time period.
MERCHANT COUNTS HAVE NOT KEPT PACE
The growth in spending is unremarkable if it is a result of an increase in supply. If there is a corresponding increase in the number of available merchants, then the increase in spending is simply a reflection of a greater opportunity to purchase at hospitality and takeaways.
While the total number of outlets has increased, the overall growth has been an order of magnitude lower than that of the spending – total merchants are up 0.8% p.a. from 2013 to Q2 2018. In fact, in 2017 and 2018 to date, there has been a slight decrease in the number of merchants in this category across the country.
HOWEVER, MERCHANTS ARE CONSTANTLY CYCLING
While the overall number of active merchants is not dramatically increasing, it isn’t completely true to say that the growth in spending is not related to new merchants entering the market. As with all retail categories, takeaways and hospitality is in a constant state of flux, with merchants cycling in and out of the market.
In general, 13-15% of the active Takeaways, Cafes, and Restaurants each year will either have opened in the last 12 months or be about to close in the next 12 months. While the number of merchants that are active throughout an entire year is increasing, the number of new merchants appearing has been decreasing slightly. On top of this, the number of merchants closing their doors has increased over the last five years, from 905 in 2013 to 973 last year.
8.1%
8.2%
7.3%
7.1%
6.3%
6.4%
6.2%
6.5%
6.7%
6.7%
REGIONAL VARIETY
While Canterbury is experiencing a high net turnover of merchants, the number of new openings has outpaced their closures, with their market in net growth overall.
There is no clear relationship between merchant attrition and spending growth, and that’s because turnover is not necessarily a good or bad thing. By comparing both we can identify the regions which are performing well on both measures.
In the upper-left area, we see regions that have higher than average growth, with lower than average turnover:
Provided that growth is high, low turnover is desirable and represents stable supply with increasing demand.
In the upper-right, we see regions with high growth and high turnover:
While these markets are displaying healthy growth, the high turnover of merchants indicates that these are more competitive areas for operators.
There are four regions with below-average growth (with Auckland sitting at almost the exact average); Wellington, Taranaki, Canterbury, and Marlborough. In the case of Taranaki and Wellington, the low turnover could be indicative of a market becoming stale. However it is important to keep in mind that while these markets sit below the national growth rate, they have still grown by at least 5.9% in 2017.
Consumers are favouring eating out as a meal option now more than ever before. While in absolute terms, the level of supply has not grown at a comparable rate, there has been a constant cycle of merchants entering and leaving the market, helping the keep the offering fresh.
The high turnover in merchants suggests that consumers are demanding more from their out of home dining. Takeaways becoming more ‘gourmet’ should see their popularity continue increasing, with successful operators enjoying the strong trend in consumer demand for high quality food with increased convenience.